Note: If the data here is old, try to refresh the page using ctrl-F5 on Windows and cmd-alt-r on macOS, and/or clear your browser’s cache.
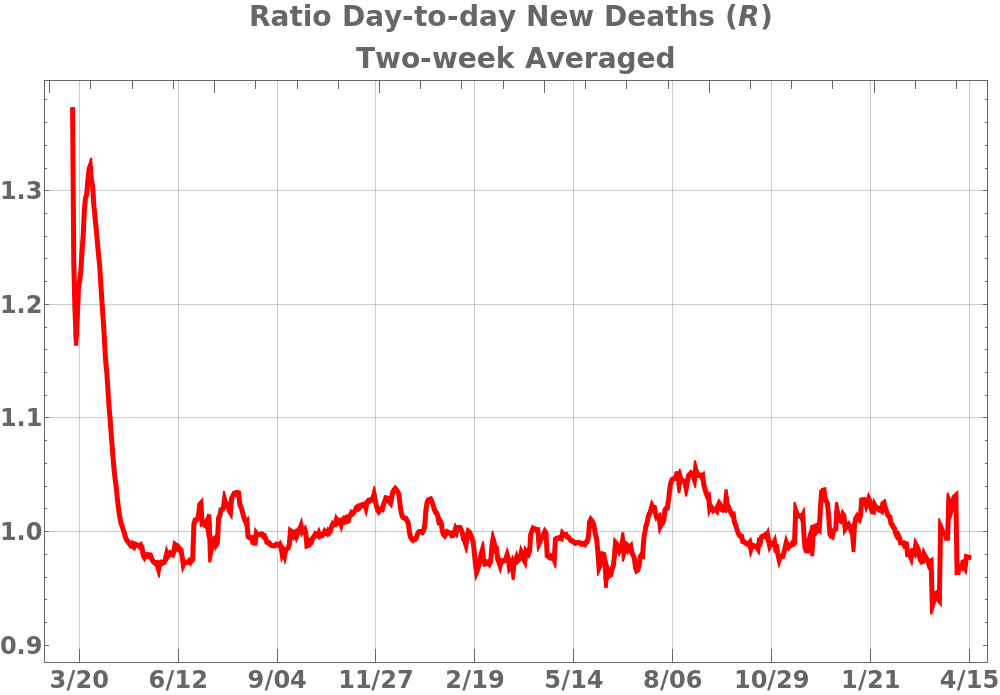
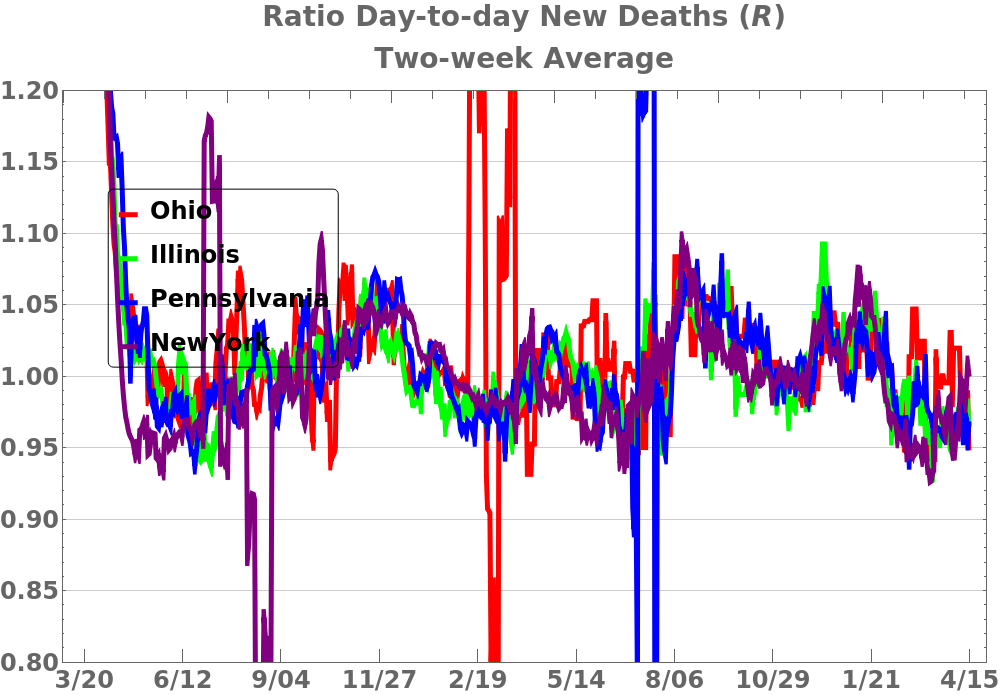
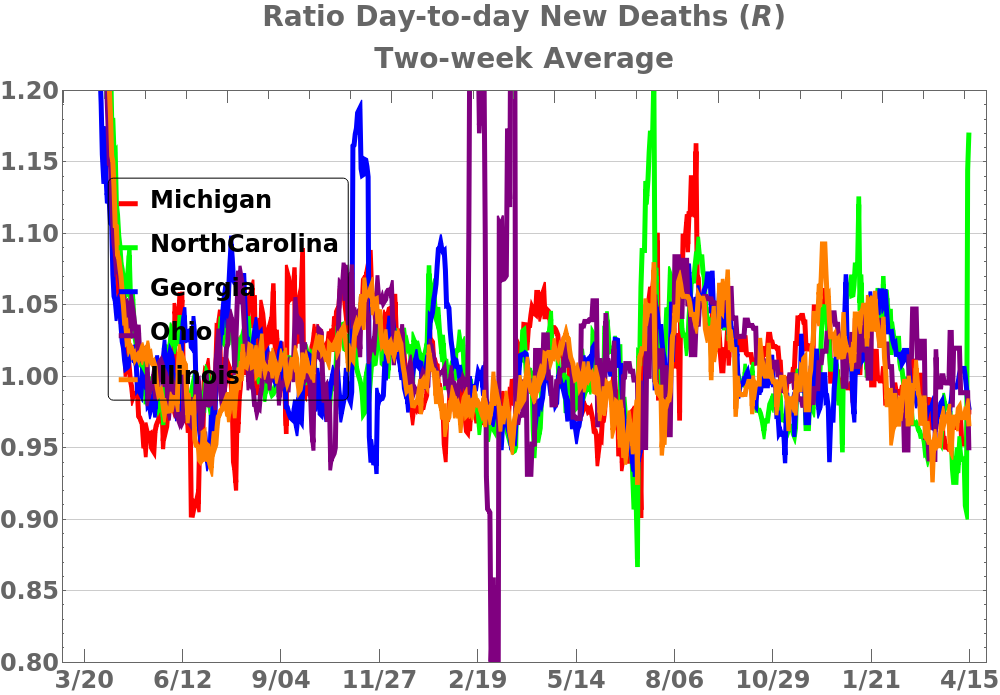
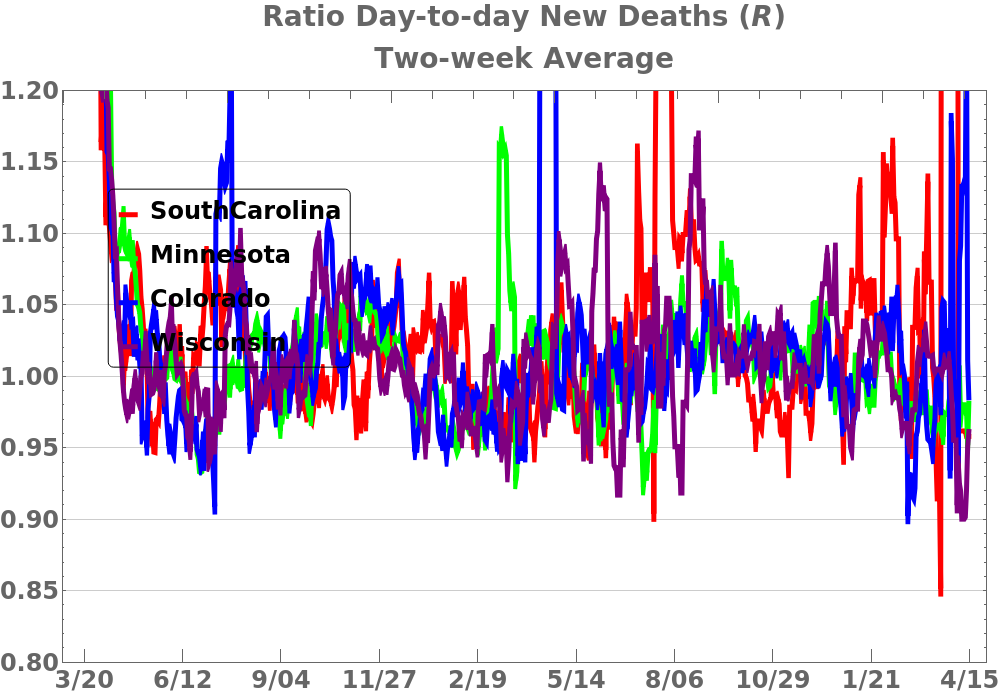
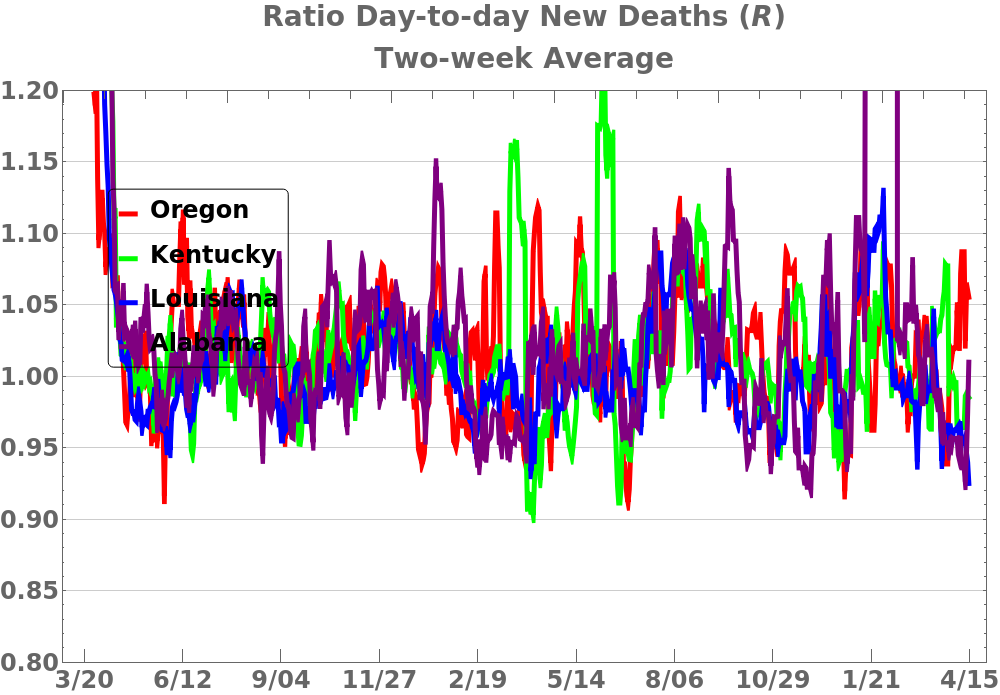
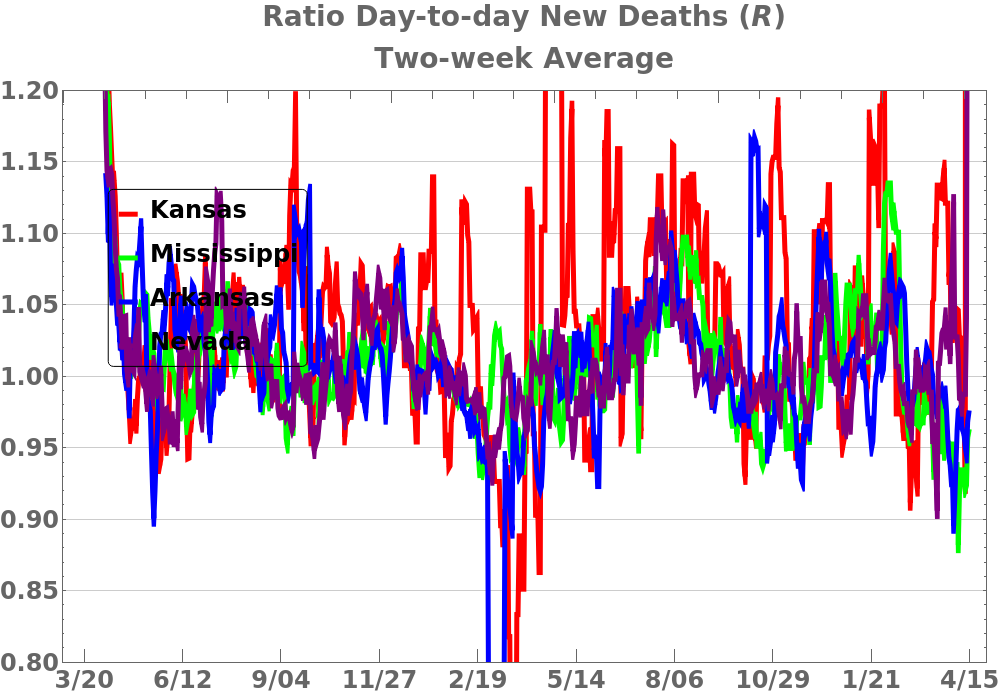
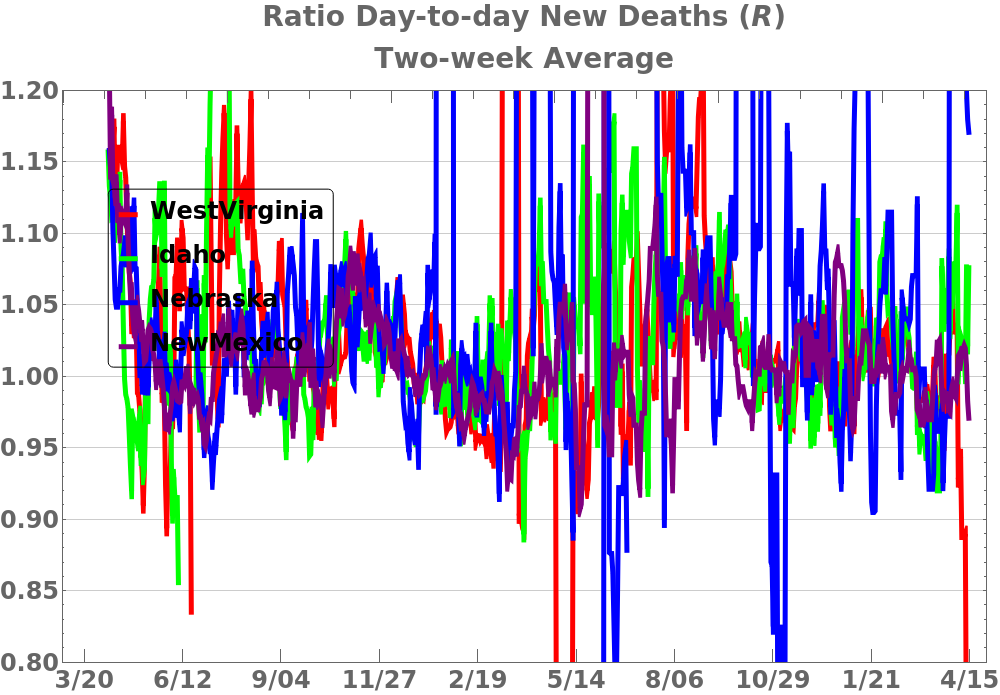
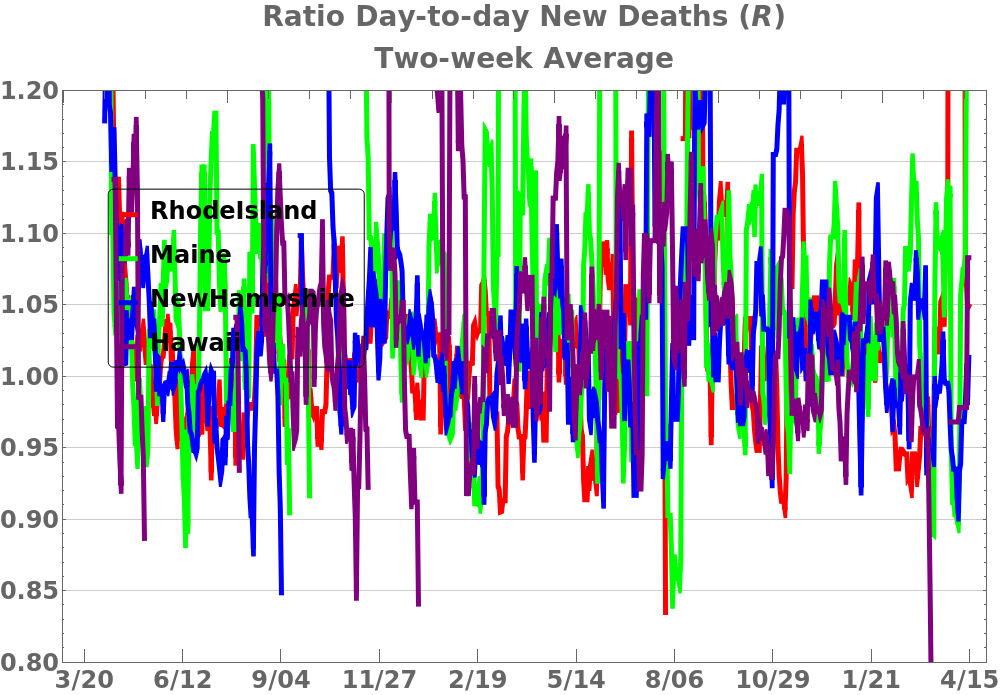
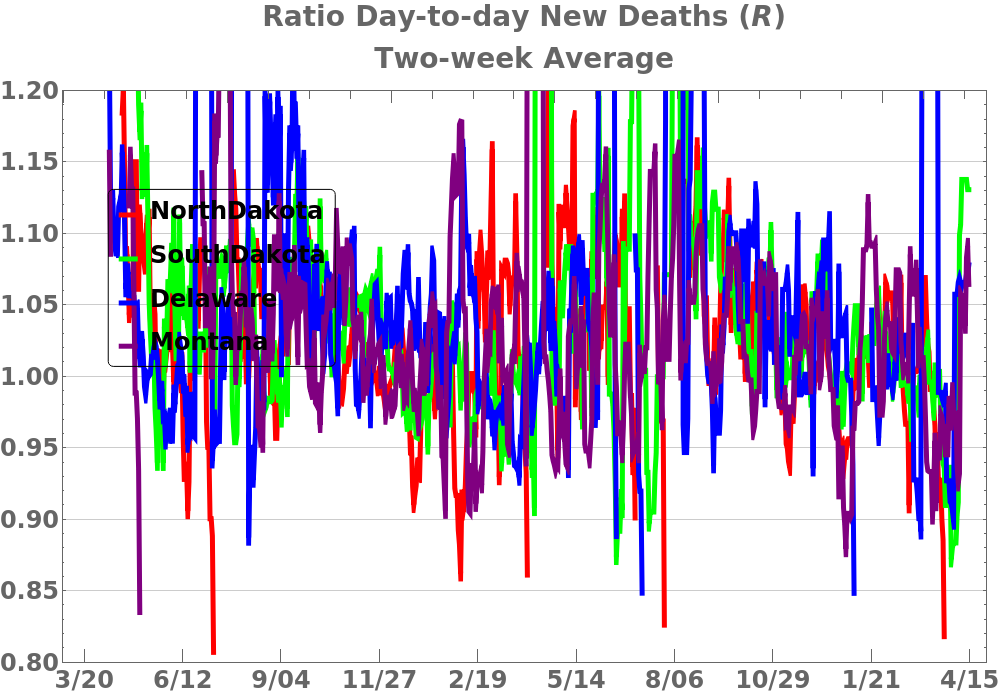
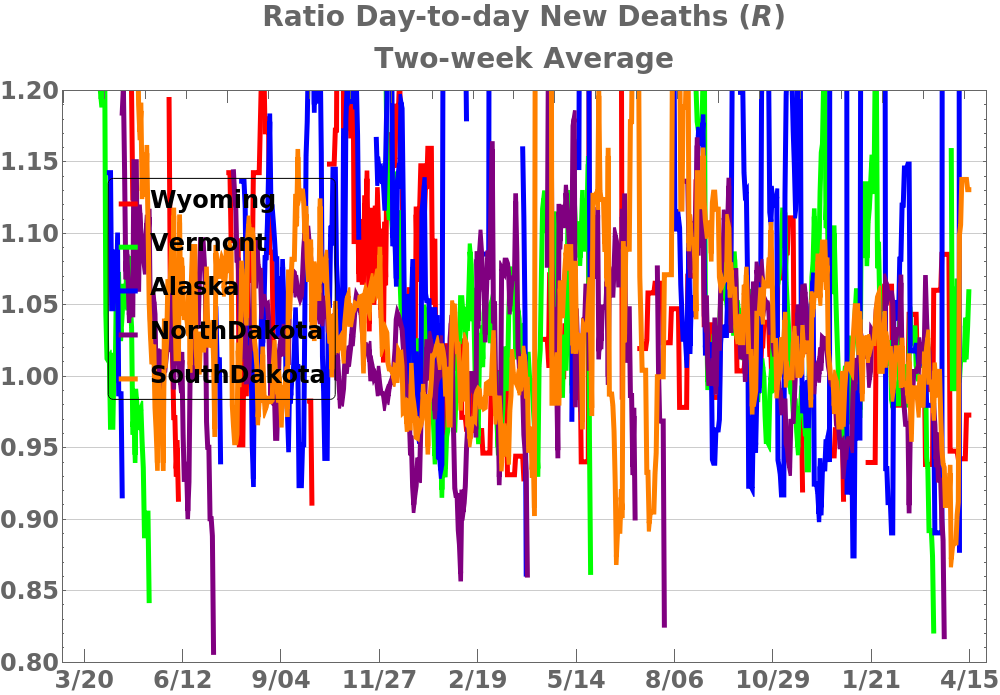
These plots show the ratio (R) of deaths from one day to the next. This is a common metric used to determine whether something is growing exponentially (R > 1), decaying exponentially (R < 1), or growing linearly (R = 1). For example, if R = 2 for a day then the deaths that day were twice that of the previous day. If R = 2 over a number of days then whatever is being measured is doubling every day. See the Day-to-day Ratio of Infections page for further explanation. I used a two-week moving average for the deaths for a given day to smooth out the noise in reporting.