Unstable Focus

Spiraling away from equilibrium

  • About
  • Visualizing Data ▼
    • Monty Hall Problem Simulator
    • Visualizing Populations and Migration ▶︎
      • Migration To and From Each County by State
      • Migration Between States
      • State Population Changes
    • Elections and Politics (coming soon) ▶︎
    • Other Visualizations (more coming soon) ▶︎
      • Misc Visualizations
      • Employment/Salary Visualizations
      • Human Chirality
    • Visualizing COVID-19 (being updated) ▶︎
      • Commentary
      • Data and Visualization Posts
      • COVID-19 Deaths by State
      • Estimating COVID-19 Mortality Rate
      • Running Totals ▶︎
        • Total Infections
        • Total Deaths
        • Overall Mortality
        • Comparisons
      • Daily Changes ▶︎
        • New Infections
        • New Deaths
        • Incremental Mortality
        • Infections/Deaths per Test
      • Day-to-day Ratios ▶︎
        • Infections
        • Deaths
      • 3D Animations ▶︎
        • Infections
        • Deaths
        • Daily Infections
        • Daily Deaths
        • Mortality Rate
        • Comparisons
      • 2D Animations ▶︎
        • Infections
        • 1 in 100 Infected
        • Deaths
        • 1 in 1000 Dead
        • Daily Infections
        • Daily Deaths
        • Mortality Rate
  • Politics
  • Work
  • Life
  • Rant
  • Penn State
  • My Story

Human Chirality

For many years I asked students in my classes how they crossed their arms, either right arm over left or left arm over right.  The breakdown was anecdotally almost always 50% for each, and it did not seem to depend whatsoever on what their dominant hand was.  Later, I noticed that how they laced their fingers and clapped their hand also did not seem to depend on their dominant hand.  Thus, I created a survey using Google Forms and asked for responses on Reddit.  The following graphics summarize the results after nearly 1,000 responses.

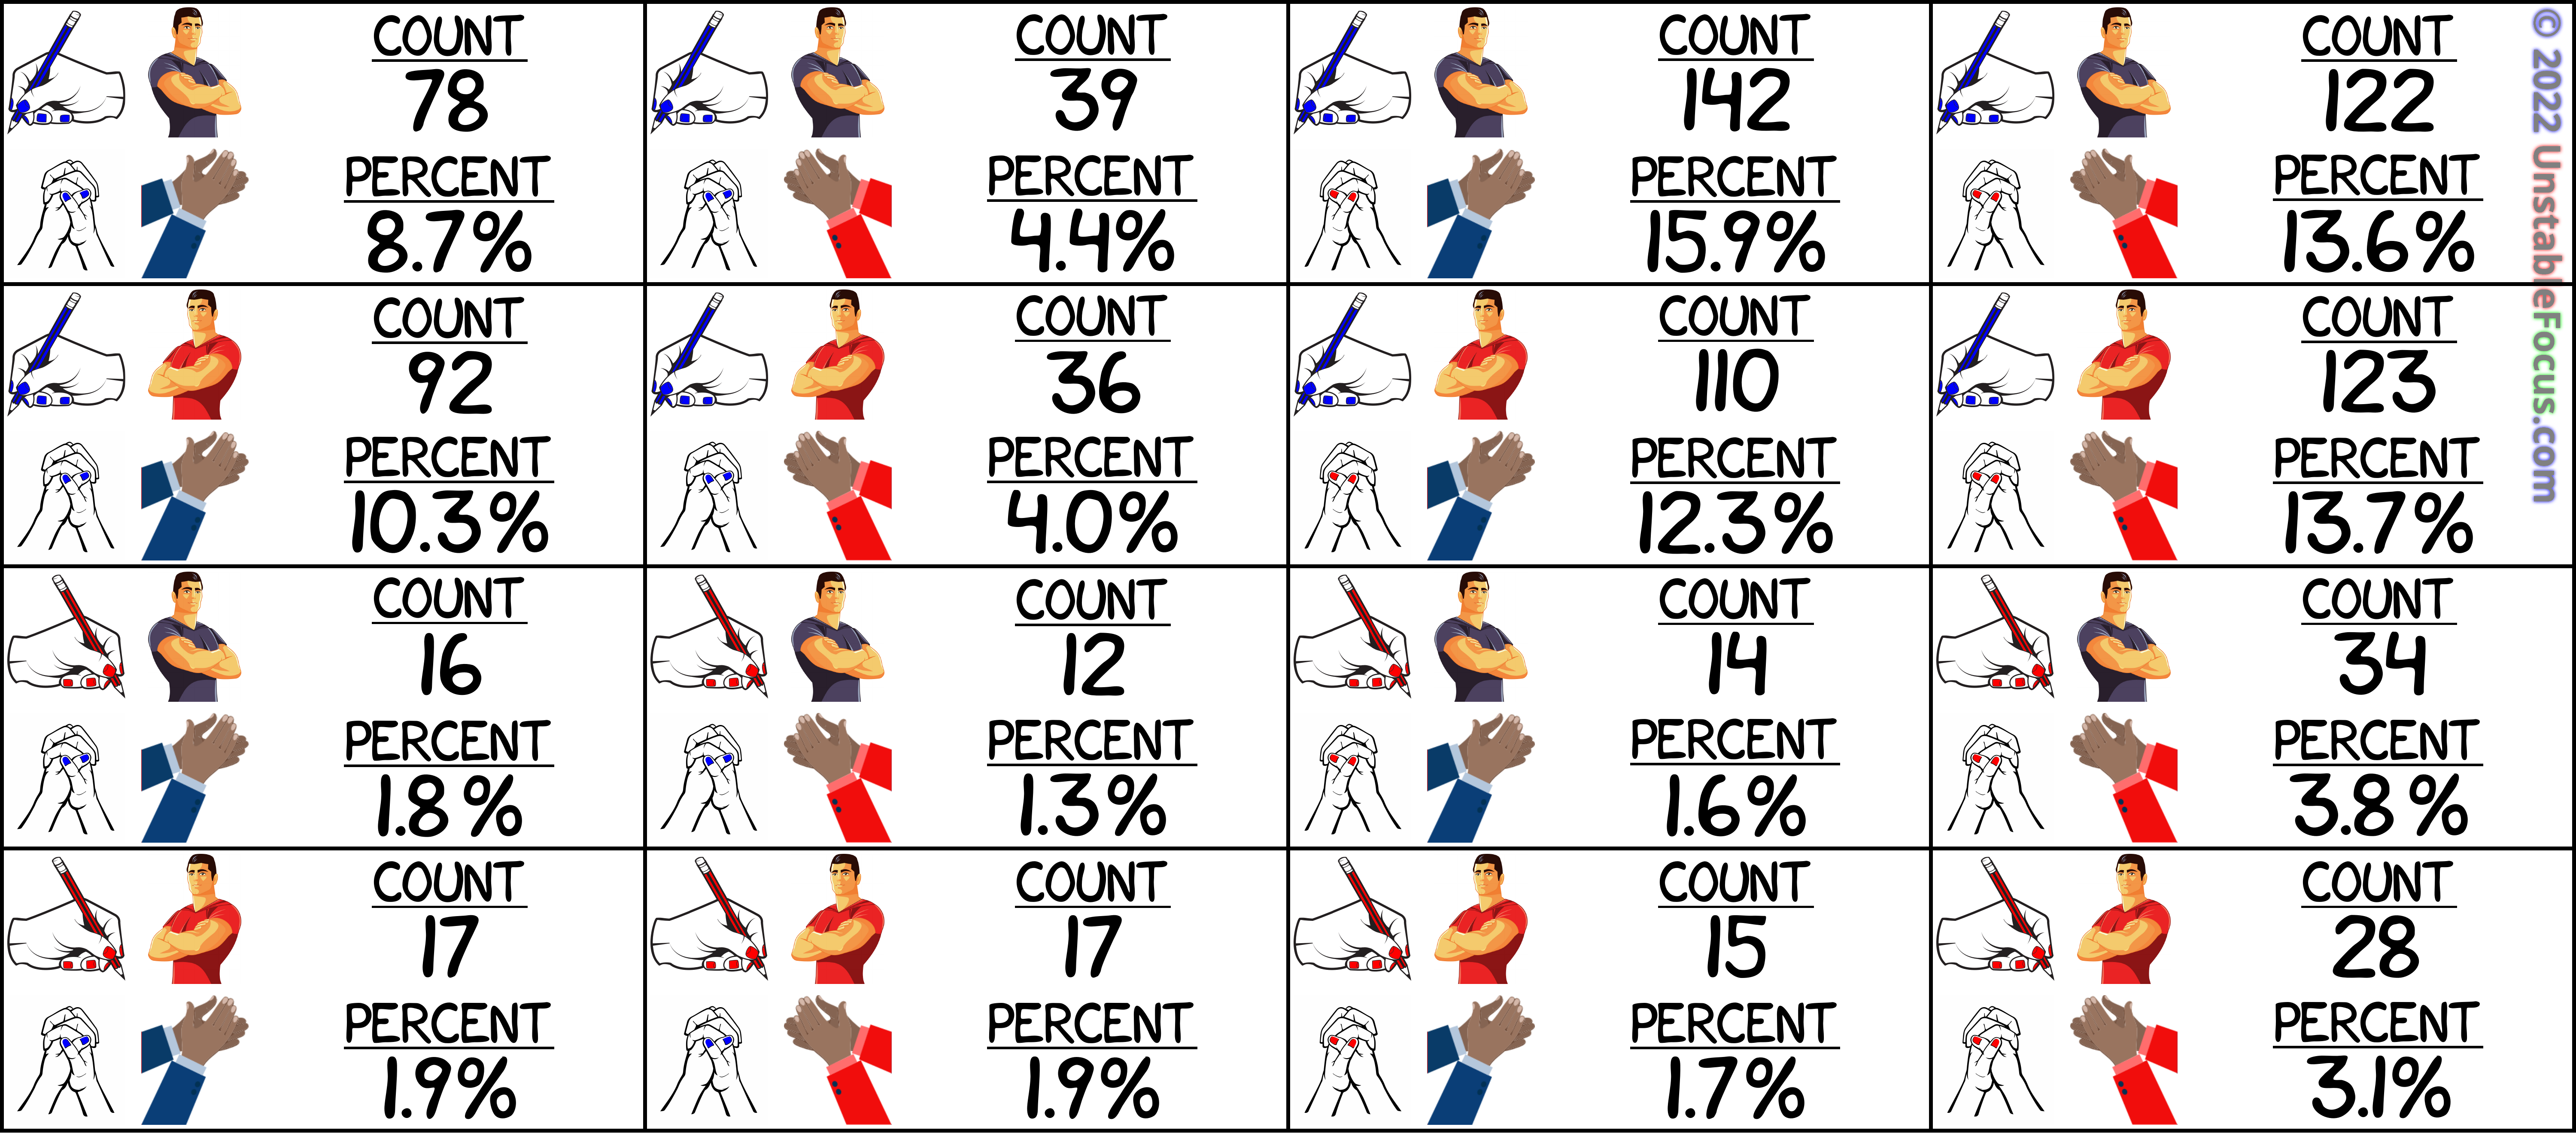
The first image shows the results for each of the 16 combinations as indicated by the inset graphic.

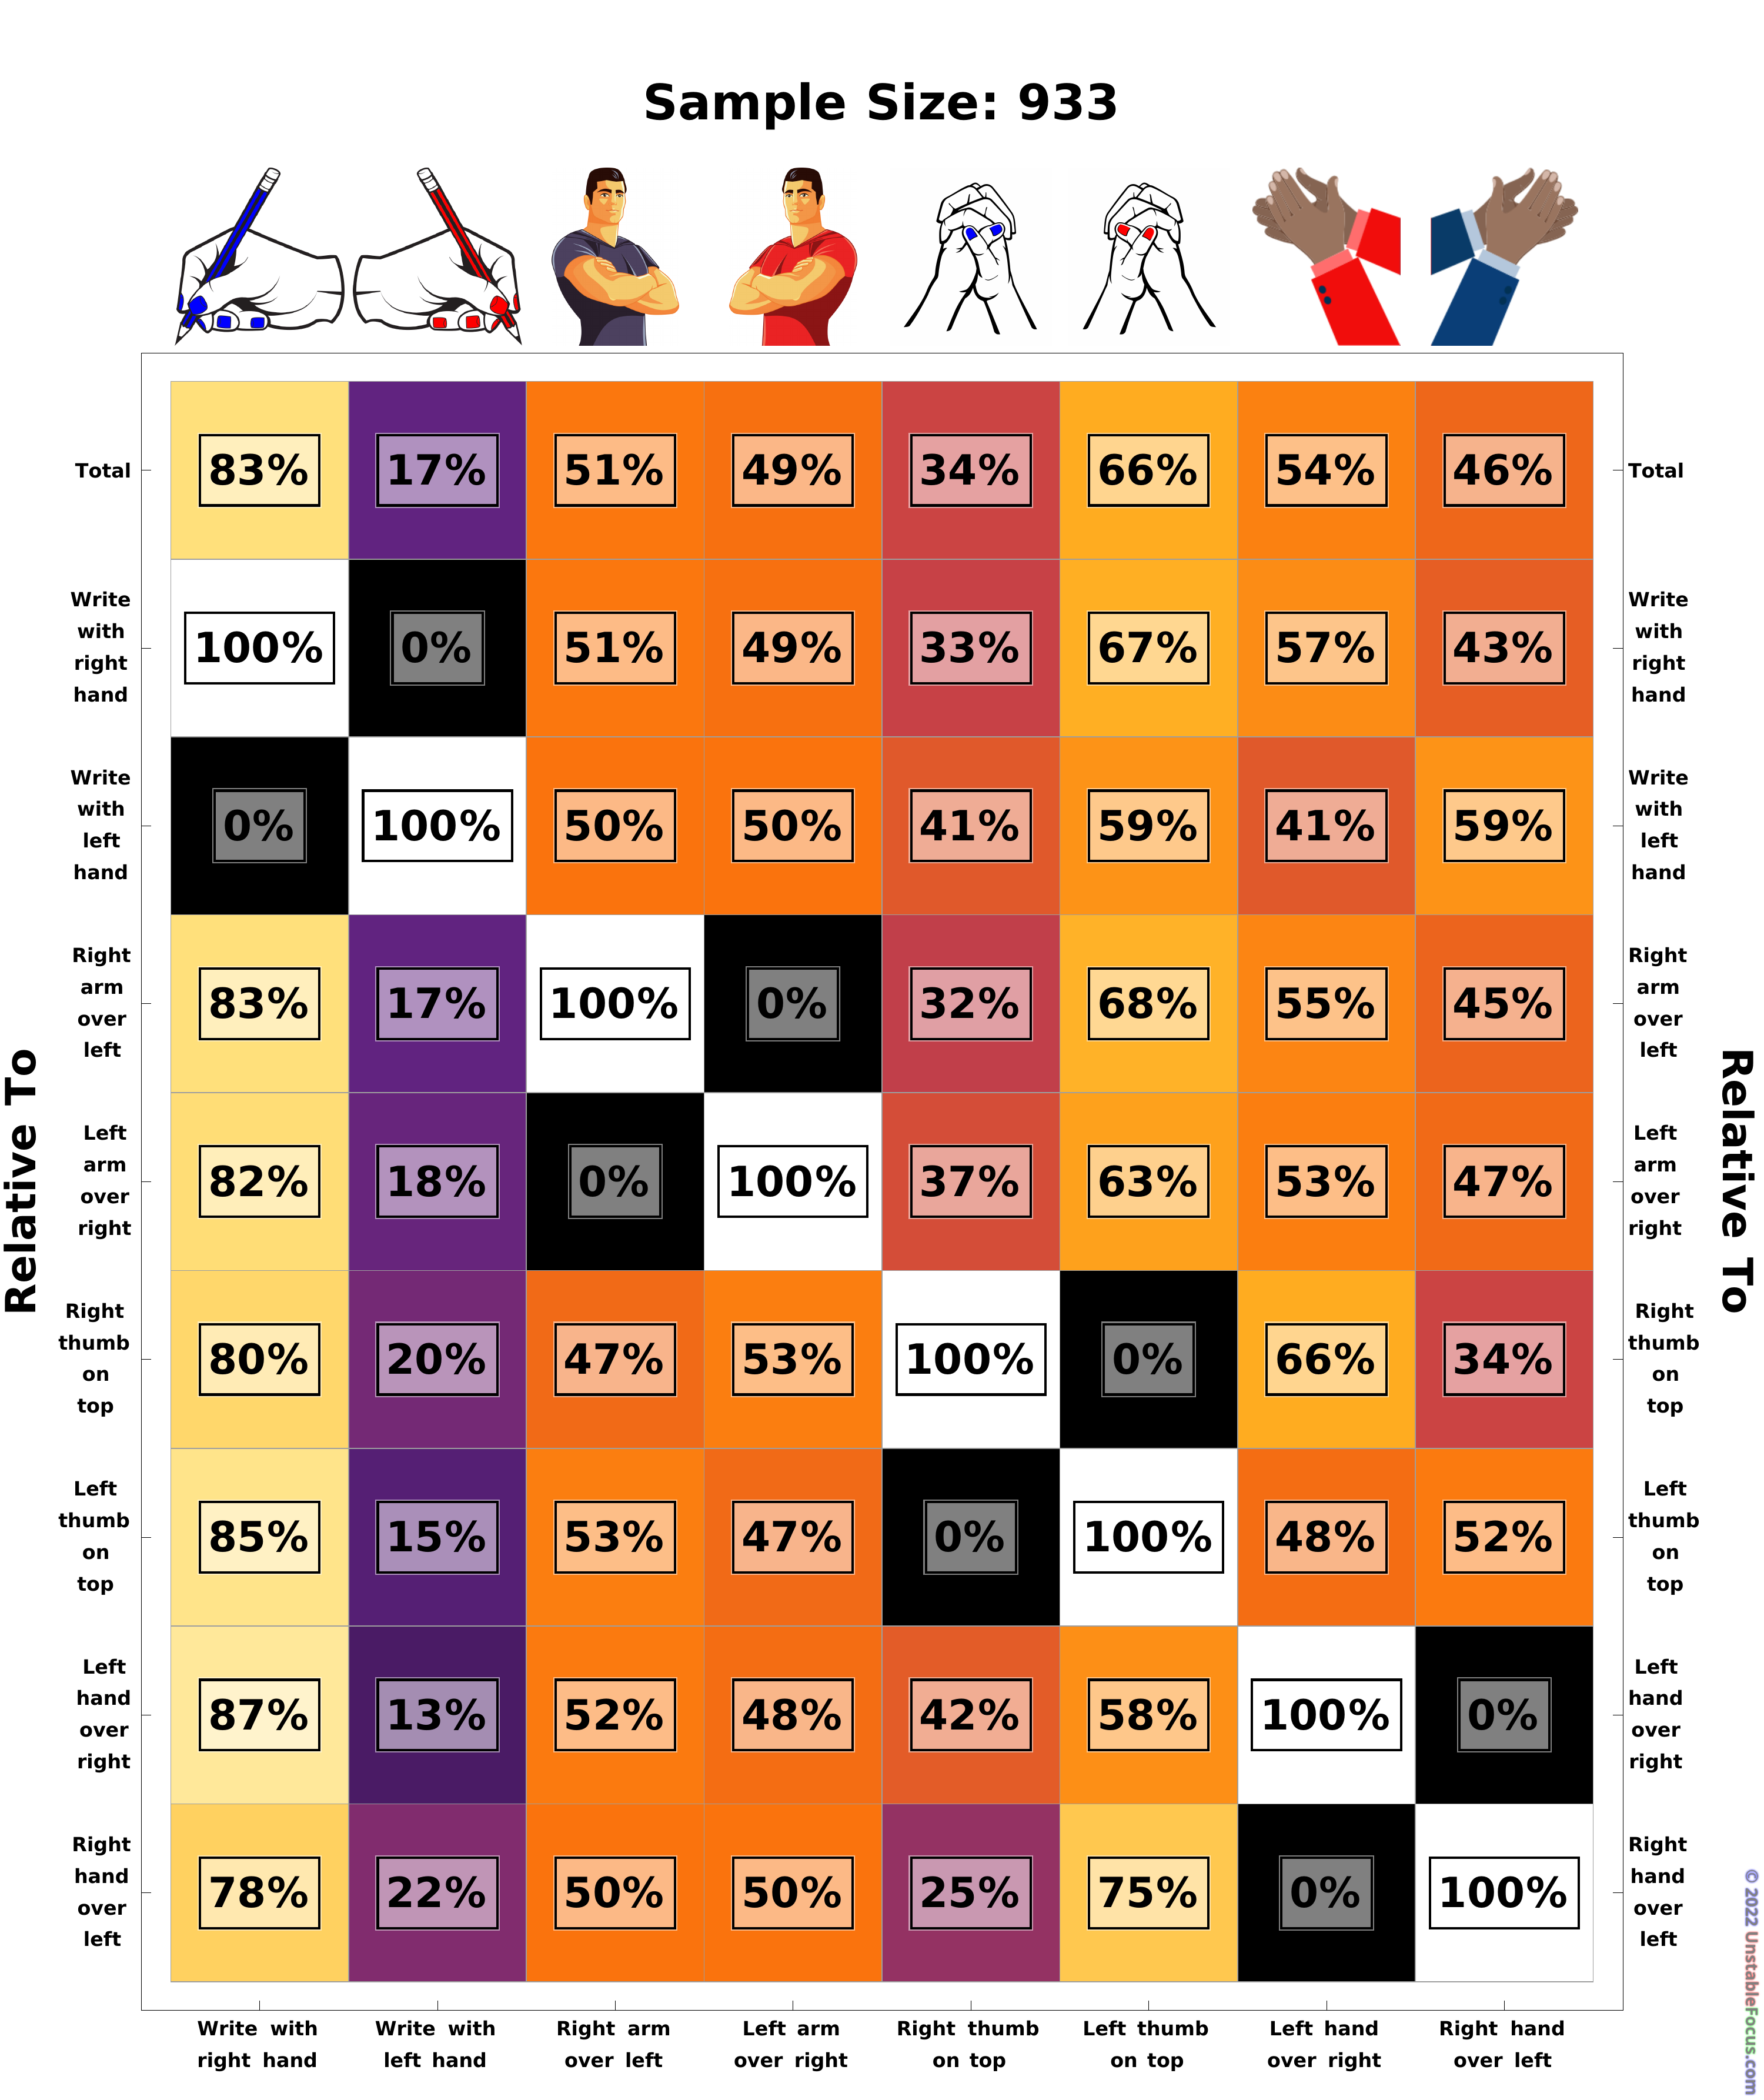
The second image contains the same information but presents it in a different way.

The final image shows the breakdown between all combinations.  This one contains the most detail and takes some time to digest.  As an example, of the respondents, 17% of the total were left-handed.  Going down the left-handed column, you see that only 13% of left-handers clapped with their left hand over their right.  Thus, there may be a slight correlation between being left-handed and clapping with your right hand over your left.  Note, however, that besides the zero and 100% entries, the values in each column are very close to one another.  This suggests that there really is no correlation between how people do these common things.

Feel free to add your own data by following the link.

Click on each image to view a higher resolution version.  To see an even higher resolution, right-click on the expanded image and view it in another tab/window.

  • February 2023
    M T W T F S S
     12345
    6789101112
    13141516171819
    20212223242526
    2728  
    « May    
  • Recent Posts

    • Martian Immigration
    • Excess Deaths, Comorbidities and COVID-19
    • Violence during protests
    • Trump vs. Twitter V
    • Executive Orders I
  • Archives

    • May 2022
    • August 2020
    • May 2020
    • March 2020
    • September 2016
    • July 2015
    • May 2015
    • July 2014
    • February 2013
    • August 2012
    • July 2012
    • May 2012
    • April 2012
  • Pages

    • 1 in 100 Infected
    • 1 in 1000 Dead
    • About
    • Animations 2D
    • Animations 3D
    • Comparison to Leading Causes of Death
    • Comparison to Other Causes
    • COVID-19 Deaths
    • COVID-19 Deaths in Alabama
    • COVID-19 Deaths in Alaska
    • COVID-19 Deaths in Arizona
    • COVID-19 Deaths in Arkansas
    • COVID-19 Deaths in California
    • COVID-19 Deaths in Colorado
    • COVID-19 Deaths in Connecticut
    • COVID-19 Deaths in Delaware
    • COVID-19 Deaths in District Of Columbia
    • COVID-19 Deaths in Florida
    • COVID-19 Deaths in Georgia
    • COVID-19 Deaths in Hawaii
    • COVID-19 Deaths in Idaho
    • COVID-19 Deaths in Illinois
    • COVID-19 Deaths in Indiana
    • COVID-19 Deaths in Iowa
    • COVID-19 Deaths in Kansas
    • COVID-19 Deaths in Kentucky
    • COVID-19 Deaths in Louisiana
    • COVID-19 Deaths in Maine
    • COVID-19 Deaths in Maryland
    • COVID-19 Deaths in Massachusetts
    • COVID-19 Deaths in Michigan
    • COVID-19 Deaths in Minnesota
    • COVID-19 Deaths in Mississippi
    • COVID-19 Deaths in Missouri
    • COVID-19 Deaths in Montana
    • COVID-19 Deaths in Nebraska
    • COVID-19 Deaths in Nevada
    • COVID-19 Deaths in New Hampshire
    • COVID-19 Deaths in New Jersey
    • COVID-19 Deaths in New Mexico
    • COVID-19 Deaths in New York
    • COVID-19 Deaths in North Carolina
    • COVID-19 Deaths in North Dakota
    • COVID-19 Deaths in Ohio
    • COVID-19 Deaths in Oklahoma
    • COVID-19 Deaths in Oregon
    • COVID-19 Deaths in Pennsylvania
    • COVID-19 Deaths in Rhode Island
    • COVID-19 Deaths in South Carolina
    • COVID-19 Deaths in South Dakota
    • COVID-19 Deaths in Tennessee
    • COVID-19 Deaths in Texas
    • COVID-19 Deaths in Utah
    • COVID-19 Deaths in Vermont
    • COVID-19 Deaths in Virginia
    • COVID-19 Deaths in Washington
    • COVID-19 Deaths in West Virginia
    • COVID-19 Deaths in Wisconsin
    • COVID-19 Deaths in Wyoming
    • COVID-19 Mortality Rate
    • COVID-19 Mortality Rate 2D
    • Daily Changes
    • Daily Deaths Attributed to COVID-19
    • Daily Deaths Attributed to COVID-19 2D
    • Daily Infections Attributed to COVID-19
    • Daily Infections Attributed to COVID-19
    • Day-to-day Ratio of Deaths
    • Day-to-day Ratio of Infections
    • Day-to-day Ratios
    • Deaths Attributed to COVID-19
    • Deaths Attributed to COVID-19 2D
    • Elections and Politics
    • Employment Visualizations
    • Estimating COVID-19 Mortality Rate
    • glossary
    • Human Chirality
    • Incremental Mortality
    • Infections Attributed to COVID-19
    • Infections Attributed to COVID-19 2D
    • Martian Immigration
    • Migration Between States
    • Migration To and From Each County by State
    • Migration: United States
    • Misc Visualizations
    • Monty Hall Problem Simulator
    • My Story
    • New Deaths
    • New Infections
    • Other Visualizations
    • Overall Mortality
    • Overview
    • Running Totals
    • State Population Changes
    • Test Page
    • Testing
    • Total Deaths
    • Total Infections
    • Visualizing COVID-19
    • Visualizing Data
    • Visualizing Populations and Migration
Proudly powered by WordPress Theme: Parament by Automattic.