Unstable Focus

Spiraling away from equilibrium

  • About
  • Visualizing Data ▼
    • Monty Hall Problem Simulator
    • Visualizing Populations and Migration ▶︎
      • Migration To and From Each County by State
      • Migration Between States
      • State Population Changes
    • Elections and Politics (coming soon) ▶︎
    • Other Visualizations (more coming soon) ▶︎
      • Misc Visualizations
      • Employment/Salary Visualizations
      • Human Chirality
    • Visualizing COVID-19 (being updated) ▶︎
      • Commentary
      • Data and Visualization Posts
      • COVID-19 Deaths by State
      • Estimating COVID-19 Mortality Rate
      • Running Totals ▶︎
        • Total Infections
        • Total Deaths
        • Overall Mortality
        • Comparisons
      • Daily Changes ▶︎
        • New Infections
        • New Deaths
        • Incremental Mortality
        • Infections/Deaths per Test
      • Day-to-day Ratios ▶︎
        • Infections
        • Deaths
      • 3D Animations ▶︎
        • Infections
        • Deaths
        • Daily Infections
        • Daily Deaths
        • Mortality Rate
        • Comparisons
      • 2D Animations ▶︎
        • Infections
        • 1 in 100 Infected
        • Deaths
        • 1 in 1000 Dead
        • Daily Infections
        • Daily Deaths
        • Mortality Rate
  • Politics
  • Work
  • Life
  • Rant
  • Penn State
  • My Story

Estimating COVID-19 Mortality Rate

There’s a ton of debate about what the true mortality rate of COVID-19 is, i.e. what percentage of people that contract the virus die as a result?  While we have pretty good estimates of the number of people who have died from the virus, I would guess the total number who have died from COVID-19, influenza and pneumonia is probably more accurate because it’s often hard to determine what virus the person had.

The number of people that have been infected is the hard one to estimate.  We have a number of “confirmed” cases, but we have no idea how many people had it, recovered, and never got tested.  People can make wild estimates such as the number of infections is twice the confirmed cases, or ten times the confirmed cases.  The problem is, both those number could be correct.  If someone were able to calculate it definitively I wouldn’t be surprised by either two or ten.

Some numbers that we have much more accurate counts of is the number people that have gone to a hospital for a condition die from that condition.  We know with pretty good certainty that about 4.9% of people that go to the hospital with “flu-like” symptoms (mostly pneumonia) die from it.

If we knew the number of total people going to the hospital with flu-like symptoms this year and previous years, we could calculate the mortality rate this year and for previous years and make a good assumption that any difference is due to COVID-19.  Unfortunately, the CDC does not appear to publish those numbers.  However, they do publish percentages.  So, let’s see what we can do with the data we have. 

The number we want is \nu=n^{dead}/n^{hosp}, the number of deaths from flu-like symptoms divided by the number of visits to the hospital for those symptom.  We don’t know n^{hosp} but we do know \alpha=n^{hosp}/N^{hosp} where N^{hosp} is the total number of people going to the hospital, and we know this for 2019 and 2020.  Thus, the mortality rate in 2020 is

\nu_{20}=\frac{n^{dead}_{20}}{n^{hosp}_{20}}=\frac{n^{dead}_{20}}{\alpha_{20}N^{hosp}_{20}}

and in 2019 it was

\nu_{19}=\frac{n^{dead}_{19}}{n^{hosp}_{19}}=\frac{n^{dead}_{19}}{\alpha_{19}N^{hosp}_{19}}.

The ratio of those two mortality rates is then

\frac{\nu_{19}}{\nu_{20}}=\frac{n^{dead}_{19}}{n^{dead}_{20}}\frac{\alpha_{20}}{\alpha_{19}}\frac{N^{hosp}_{19}}{N^{hosp}_{20}}.

We could say that the total number of hospital visits in 2020 is the same as that in 2019 but I don’t think that’s fair, as anyone in a hospital knows.  Let’s assume that all the additional hospitalization were for flu-like symptoms.  So

\begin{aligned} N^{hosp}_{20}&=N^{hosp}_{19}+n^{hosp}_{20}-n^{hosp}_{19}\\&=N^{hosp}_{19}+\alpha_{20}N^{hosp}_{20}-\alpha_{19}N^{hosp}_{19}. \end{aligned}

Rearranging this gives

\frac{N^{hosp}_{19}}{N^{hosp}_{20}}=\frac{1-\alpha_{20}}{1-\alpha_{19}}.

Substituting this into the equation for the ratio of mortality rates gives

\frac{\nu_{19}}{\nu_{20}}=\frac{n^{dead}_{19}}{n^{dead}_{20}}\frac{\alpha_{20}}{\alpha_{19}}\frac{1-\alpha_{20}}{1-\alpha_{19}}.

Let’s do some sanity checks on this to see if it makes sense.  If n_{20}^{dead}=n_{19}^{dead} and \alpha_{20}=\alpha_{19}, then we see the \nu_{20}=\nu_{19}.  Thus if nothings changed the mortality rate hasn’t either.  Let’s now say n_{20}^{dead}=5 n_{19}^{dead} (the number of flu-like deaths in 2020 is five times that in 2019 over the same period), \alpha_{19}=5\% (the percentage of people in the hospital for flu-like symptoms in 2019 was 5%), and \alpha_{20}=11\% (the percentage of people in the hospital for flu-like symptoms in 2020 is 11%).  Then we find that \nu_{20} = 2.25 \nu_{19}.  Thus, if 4.9% of people going to the hospital with flu-like symptoms died in 2019 then 12% of them are dying now.

We can also try to get a better estimate of the ratio n_{20}^{dead}/n_{10}^{dead} because the CDC gives percentages of total deaths at hospitals that have been attributed to flu-like symptoms.  I will denote this percentage by \beta.  The algebra proceeds much like it did before, with the ratio of deaths from flu-like symptoms in 2020 to that in 2019 given by

\frac{n^{dead}_{19}}{n^{dead}_{20}}=\frac{\beta_{19}N^{dead}_{19}}{\beta_{20}N^{dead}_{20}}.

Again, it’s probably not good to assume the total number of people that died at a hospital this year is the same as last year.  Thus, we will attribute the total extra deaths to deaths from flu-like illnesses,

\begin{aligned} N^{dead}_{20}&=N^{dead}_{19}+n^{dead}_{20}-n^{dead}_{19}\\&=N^{dead}_{19}+\beta_{20}N^{dead}_{20}-\beta_{19}N^{dead}_{19}. \end{aligned}

As before for visits to the hospital, we get

\frac{N^{dead}_{19}}{N^{dead}_{20}}=\frac{1-\beta_{20}}{1-\beta_{19}}

for total deaths, or

\frac{n^{dead}_{19}}{n^{dead}_{20}}=\frac{\beta_{19}}{\beta_{20}}\frac{1-\beta_{20}}{1-\beta_{19}}

for flu-like deaths.  Substituting this into the equation for the ratio of mortality rates gives

\frac{\nu_{19}}{\nu_{20}}=\frac{\alpha_{20}}{\alpha_{19}}\frac{\beta_{19}}{\beta_{20}}\frac{1-\beta_{20}}{1-\beta_{19}}\frac{1-\alpha_{20}}{1-\alpha_{19}}.

Time for some sanity checks.  If the percentage of people in the hospital with flu-like symptoms had not changed from 2019 to 2020 and the percentage of all deaths at the hospital cause by flu-like symptoms did not change from 2019 to 2020, then all the ratios are one and the mortality rate this year would be the same as last year.  Good.  Let’s look at another case:

  • \beta_{19}=6\%:  the percentage of hospital deaths from flu-like symptoms in 2019 is 6%
  • \beta_{20}=22\%:  the percentage of hospital deaths from flu-like symptoms in 2020 is 22%
  • \alpha_{19}=6\%:   the percentage of people going to the hospital for flu-like symptoms in 2019 is 6%
  • \alpha_{20}=20\%:  the percentage of people going to the hospital for flu-like symptoms in 2019 is 11%

This gives a mortality rate of those going to hospital in 2020 equal to 2.55 times that of 2019 or 12.5% if it was 4.9% in 2019, i.e. \nu_{20} = 2.55 \nu_{19} = 12.5\%.

https://www.cdc.gov/coronavirus/2019-ncov/covid-data/covidview/index.html
https://www.cdc.gov/flu/weekly/index.htm
https://www.cdc.gov/coronavirus/2019-ncov/covid-data/covidview/index.html


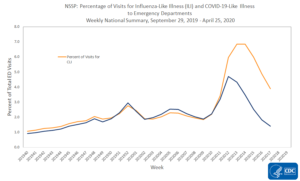
These are roughly the latest numbers from the CDC but it’s hard to get a good estimate because things are changing so rapidly.  For example the percentage of hospital deaths from flu-like symptoms spiked a couple weeks after the percentage of hospital visits for those symptom.

The other thing that is really hard to determine is how COVID-19 has contributed to the increased mortality rate, because to determine that we need to know how many of the flu-like deaths/hospitalizations are from COVID-19.  We have rough estimates of this but I suspect that without testing the people who have died or who have been hospitalized (which is a waste of tests) the medical professionals don’t really know.

Let’s see if we can extract the hospitalized mortality rate for COVID-19 from the hospitalized mortality rate for all flu-like symptoms.  We know \mu_{20}=\lambda\mu_{19} where \lambda is that long expression above involving and the \beta's and \alpha's.  Thus,

\frac{n_{20}^{dead}}{n_{20}^{hosp}}=\frac{n_{20}^{dc}+n_{20}^{df}}{n_{20}^{hc}+n_{20}^{hf}}=\lambda \frac{n_{19}^{df}}{n_{19}^{hf}}.

To shorten the notation a bit ‘dc’ means dead from COVID-19, ‘df’ means dead from other flu-like illness, ‘hc’ means went to hospital for COVID-19 symptoms, and ‘hf’ means went to hospital for other flu-like symptoms. Thus, in 2019 there are no ‘dc’ values or ‘hc’ values since we think no one had COVID-19 then. Unfortunately,

\frac{n_{20}^{dc}+n_{20}^{df}}{n_{20}^{hc}+n_{20}^{hf}}\ne\frac{n_{20}^{dc}}{n_{20}^{hc}}+\frac{n_{20}^{df}}{n_{20}^{hf}}

so the math gets a bit more complicated. What we can do is write the above equations as

\frac{n_{20}^{dc}}{n_{20}^{hc}}=\lambda \frac{n_{19}^{df}}{n_{19}^{hf}}\frac{1+n_{20}^{hf}/n_{20}^{hc}}{1+n_{20}^{df}/n_{20}^{dc}}

which gives us the thing we’re looking for, i.e. \nu_{20}^c = n_{20}^{dc}/n_{20}^{hc}.  So, we need to know the ratios of those going to the hospital with other flu-like symptoms to those going to the hospital for COVID-19 symptoms and the ratio of those dying at the hospital from other flu-like symptoms to those dying at the hospital from COVID-19 symptoms.  These are really hard to get good data from because even the people determining the cause of death are not really sure unless the person has been tested.  (I will again say, it is a bad idea to waste tests on people in the hospital or those that have died.  Regardless of what’s causing the symptoms, the treatment is the same.  And once a person has died testing them really doesn’t help anything/anybody.)

We can, however, do some sanity checks and play with some numbers.  If the two ratios are the same, then the mortality rate of COVID-19 is \lambda \nu_{10}^f.  If n_{20}^{df}/n_{20}^{dc} is larger than n_{20}^{hf}/n_{20}^{hc} then \nu_{20}^c<\lambda \nu_{10}^f.  Likewise, if n_{20}^{df}/n_{20}^{dc} is less than n_{20}^{hf}/n_{20}^{hc} then \nu_{20}^c>\lambda \nu_{10}^f.

If we want the COVID-19 mortality rate to equal the flu-like mortality rate, we take \lambda=2.55 from above, and we assume n_{20}^{hf}=n_{20}^{hc} which seems to be how hospitals are classifying visits, we would need n_{20}^{df}\approx 4 n_{20}^{dc}, and I just don’t think there’s any way that could be the case.

  • February 2023
    M T W T F S S
     12345
    6789101112
    13141516171819
    20212223242526
    2728  
    « May    
  • Recent Posts

    • Martian Immigration
    • Excess Deaths, Comorbidities and COVID-19
    • Violence during protests
    • Trump vs. Twitter V
    • Executive Orders I
  • Archives

    • May 2022
    • August 2020
    • May 2020
    • March 2020
    • September 2016
    • July 2015
    • May 2015
    • July 2014
    • February 2013
    • August 2012
    • July 2012
    • May 2012
    • April 2012
  • Pages

    • 1 in 100 Infected
    • 1 in 1000 Dead
    • About
    • Animations 2D
    • Animations 3D
    • Comparison to Leading Causes of Death
    • Comparison to Other Causes
    • COVID-19 Deaths
    • COVID-19 Deaths in Alabama
    • COVID-19 Deaths in Alaska
    • COVID-19 Deaths in Arizona
    • COVID-19 Deaths in Arkansas
    • COVID-19 Deaths in California
    • COVID-19 Deaths in Colorado
    • COVID-19 Deaths in Connecticut
    • COVID-19 Deaths in Delaware
    • COVID-19 Deaths in District Of Columbia
    • COVID-19 Deaths in Florida
    • COVID-19 Deaths in Georgia
    • COVID-19 Deaths in Hawaii
    • COVID-19 Deaths in Idaho
    • COVID-19 Deaths in Illinois
    • COVID-19 Deaths in Indiana
    • COVID-19 Deaths in Iowa
    • COVID-19 Deaths in Kansas
    • COVID-19 Deaths in Kentucky
    • COVID-19 Deaths in Louisiana
    • COVID-19 Deaths in Maine
    • COVID-19 Deaths in Maryland
    • COVID-19 Deaths in Massachusetts
    • COVID-19 Deaths in Michigan
    • COVID-19 Deaths in Minnesota
    • COVID-19 Deaths in Mississippi
    • COVID-19 Deaths in Missouri
    • COVID-19 Deaths in Montana
    • COVID-19 Deaths in Nebraska
    • COVID-19 Deaths in Nevada
    • COVID-19 Deaths in New Hampshire
    • COVID-19 Deaths in New Jersey
    • COVID-19 Deaths in New Mexico
    • COVID-19 Deaths in New York
    • COVID-19 Deaths in North Carolina
    • COVID-19 Deaths in North Dakota
    • COVID-19 Deaths in Ohio
    • COVID-19 Deaths in Oklahoma
    • COVID-19 Deaths in Oregon
    • COVID-19 Deaths in Pennsylvania
    • COVID-19 Deaths in Rhode Island
    • COVID-19 Deaths in South Carolina
    • COVID-19 Deaths in South Dakota
    • COVID-19 Deaths in Tennessee
    • COVID-19 Deaths in Texas
    • COVID-19 Deaths in Utah
    • COVID-19 Deaths in Vermont
    • COVID-19 Deaths in Virginia
    • COVID-19 Deaths in Washington
    • COVID-19 Deaths in West Virginia
    • COVID-19 Deaths in Wisconsin
    • COVID-19 Deaths in Wyoming
    • COVID-19 Mortality Rate
    • COVID-19 Mortality Rate 2D
    • Daily Changes
    • Daily Deaths Attributed to COVID-19
    • Daily Deaths Attributed to COVID-19 2D
    • Daily Infections Attributed to COVID-19
    • Daily Infections Attributed to COVID-19
    • Day-to-day Ratio of Deaths
    • Day-to-day Ratio of Infections
    • Day-to-day Ratios
    • Deaths Attributed to COVID-19
    • Deaths Attributed to COVID-19 2D
    • Elections and Politics
    • Employment Visualizations
    • Estimating COVID-19 Mortality Rate
    • glossary
    • Human Chirality
    • Incremental Mortality
    • Infections Attributed to COVID-19
    • Infections Attributed to COVID-19 2D
    • Martian Immigration
    • Migration Between States
    • Migration To and From Each County by State
    • Migration: United States
    • Misc Visualizations
    • Monty Hall Problem Simulator
    • My Story
    • New Deaths
    • New Infections
    • Other Visualizations
    • Overall Mortality
    • Overview
    • Running Totals
    • State Population Changes
    • Test Page
    • Testing
    • Total Deaths
    • Total Infections
    • Visualizing COVID-19
    • Visualizing Data
    • Visualizing Populations and Migration
Proudly powered by WordPress Theme: Parament by Automattic.
 

Loading Comments...
 

You must be logged in to post a comment.