Weight of a vote for president in each state from 1896 to 2020l
Left/right lean of each state compared to the nation from 1976 to 2020.
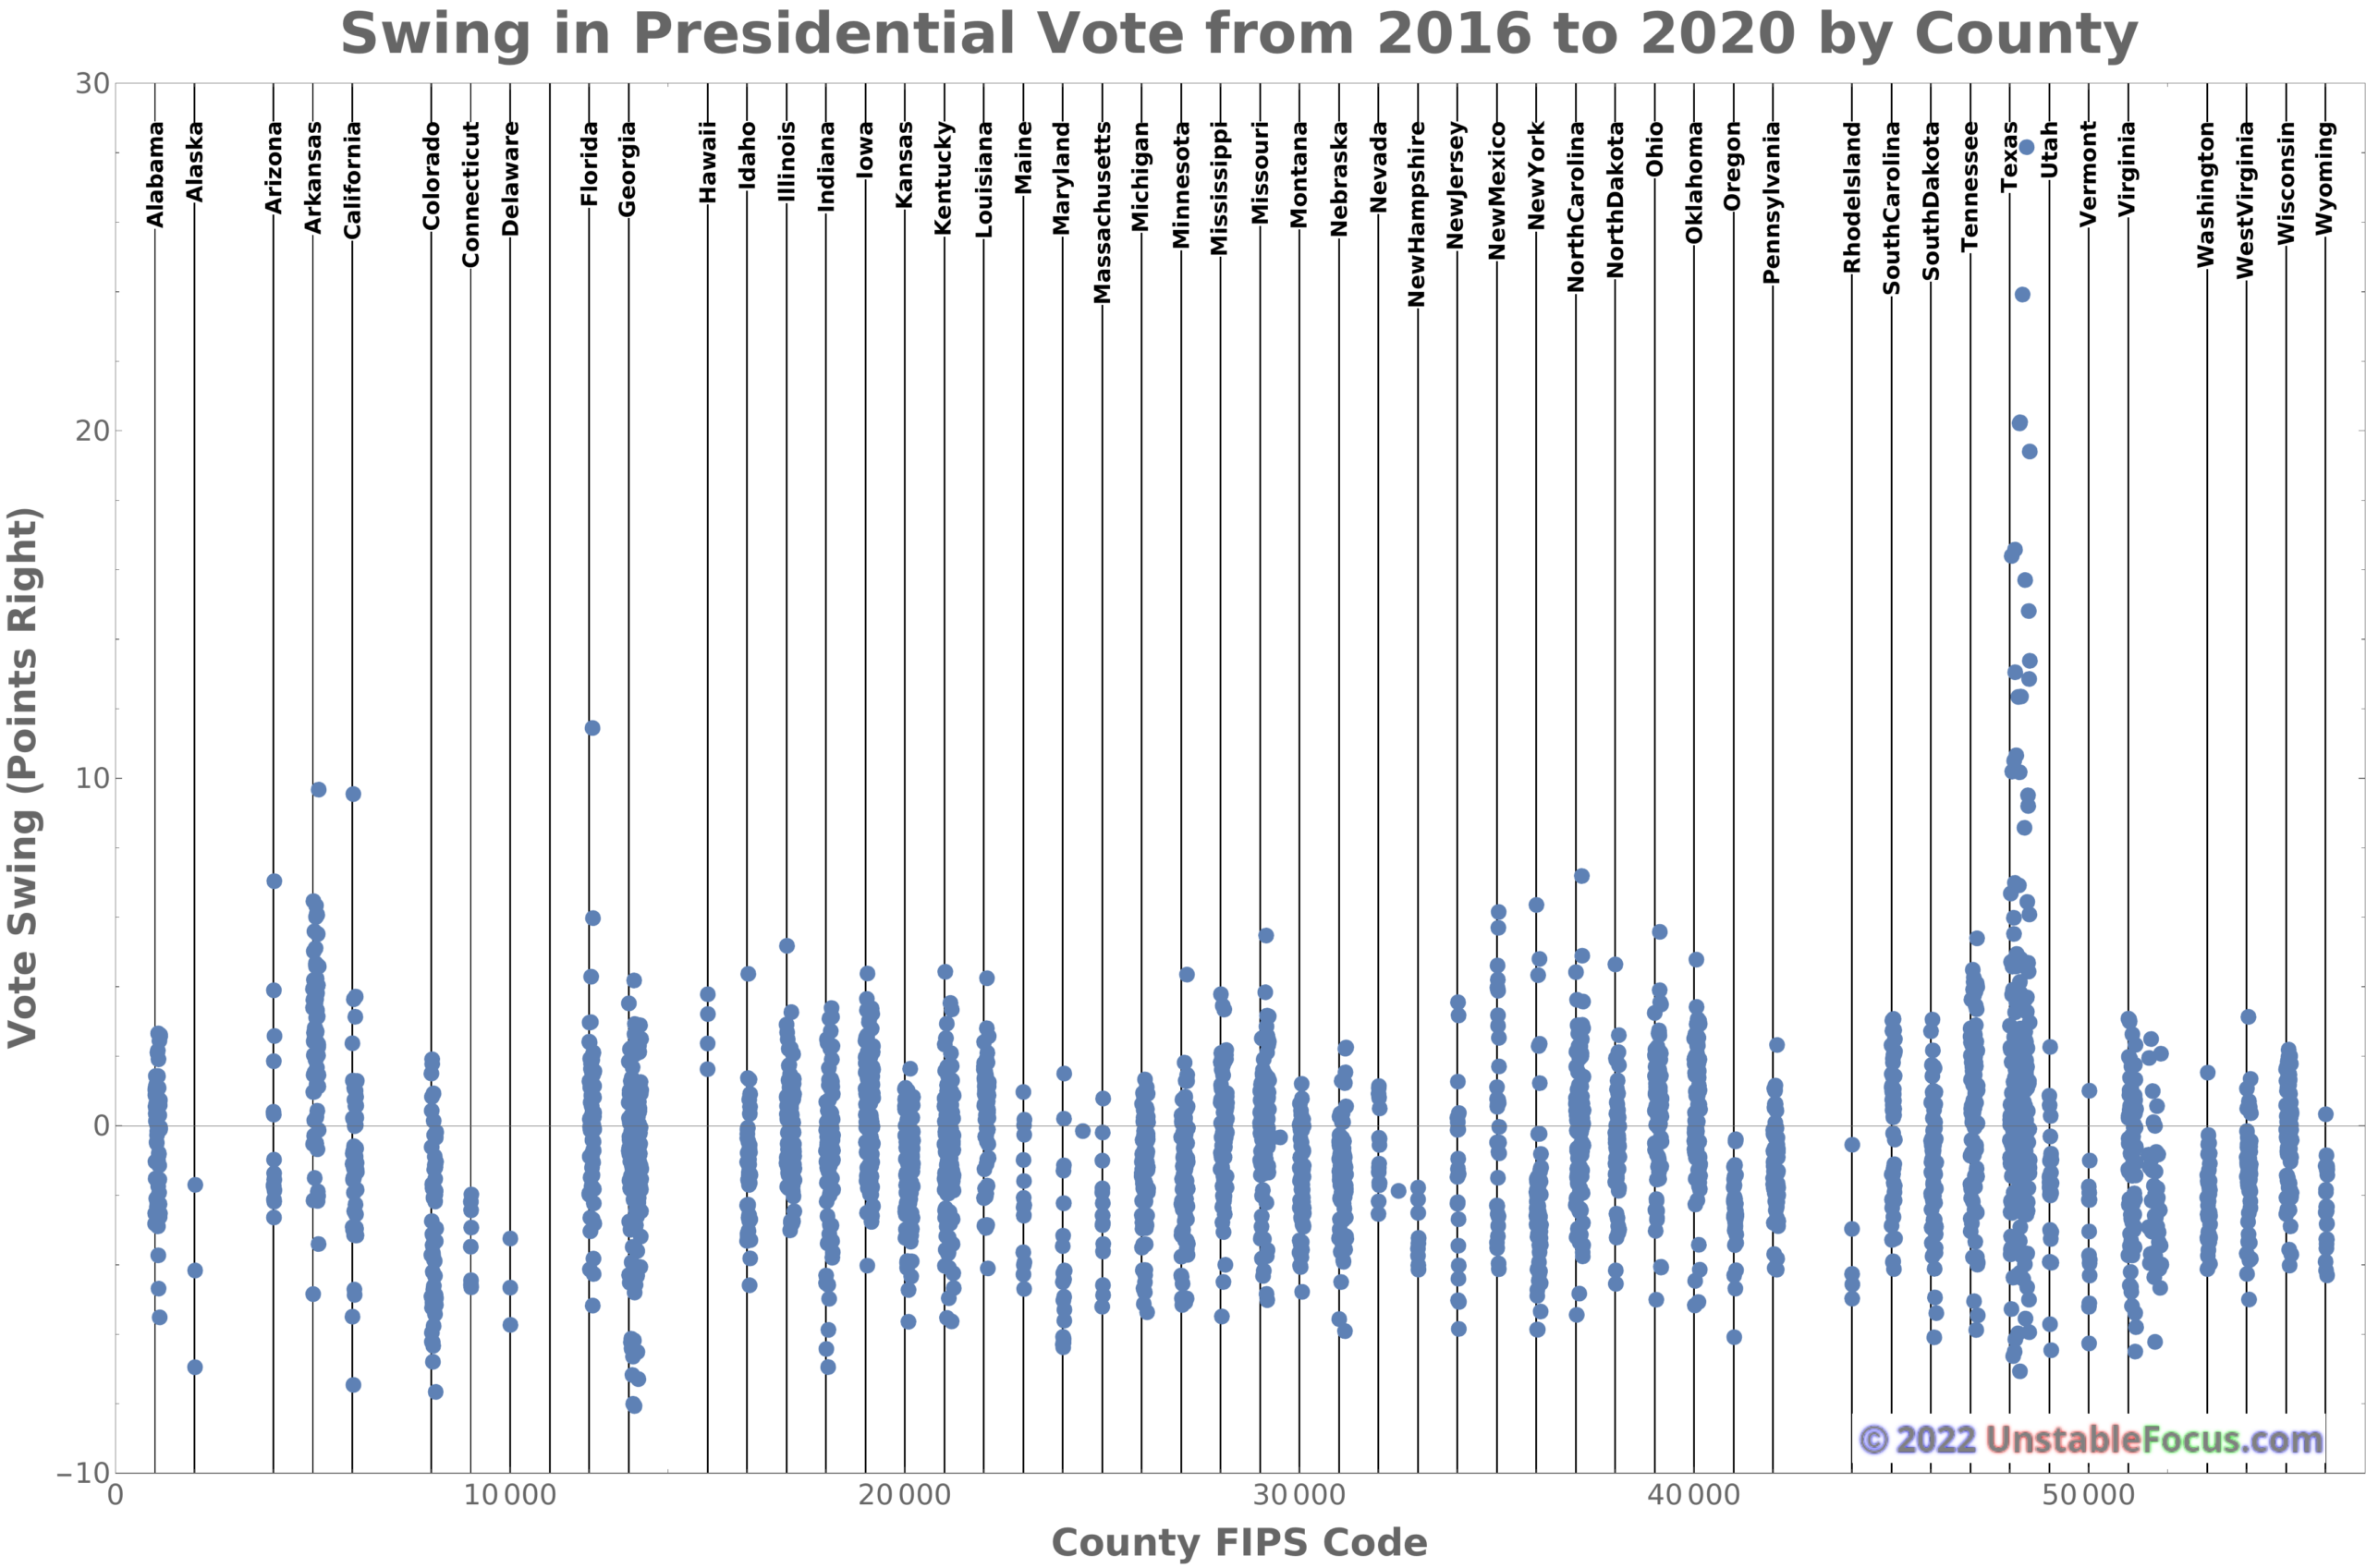
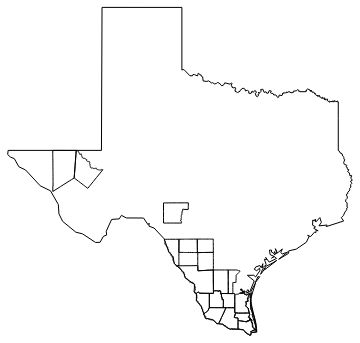
The presidential vote swing in each county from 2016 to 2020. Note the large swing to the right in many Texas counties. Some of these are very small but some have over 50,000 people. They are mostly along the Mexican border (see below).
The below video shows the vote swing animated. The dots are colored by the direction of the change. Note that while there were large swings to the right in some Texas counties (see above) they did not necessarily flip their vote.
You must be logged in to post a comment.